Stroke recovery is not always linear, and recovery takes place over weeks, months, and years. This non-linear path of recovery creates challenges in a system where payors want to see measurable gains to justify the need for ongoing therapy. Sadly, when progress is difficult to demonstrate, stroke patients are placed at risk because they may not receive the care they need or deserve.
Request a free trial of REEV SENSE to capture objective gait metrics and justify ongoing treatment.
Historically, physical therapy practice has focused on the “critical window” of the first three to six months post-stroke. During this time, there is heightened neuroplasticity, and intensive, targeted therapy can lead to significant functional recovery. While this period is undeniably important, ongoing research shows that individuals can make functional gains months or even years later (Rubio Ballester, 2019).
Dr. Nneka Ifejika, M.D., a professor of physical medicine and rehabilitation and neurology at UT Southwestern Medical Center in Dallas and a volunteer expert for the American Stroke Association, says, “I tell stroke patients that the path to recovery is not a straight line. “It has twists, turns, times of acceleration and times of pause.” (AARP, 2024)
Although we know stroke recovery is long and uneven, the timeline adds additional complications for clinicians and administrators. Extended treatment timelines frequently trigger chart audits. The threat of audits increases the pressure for documentation that clearly demonstrates progress and skilled reasoning. When progress is difficult to show, clinicians may begin to consider discharging the patient to avoid the repercussions of continuing therapy that may be denied.
Objective, accurate gait metrics captured with technology give clinicians a practical way to show progress and justify continued therapy, even during slower stages of recovery. Sensitive gait analysis technology can measure changes that are difficult to see during a visual gait analysis.
Justification of Care Combines Data with Function
Before diving into specific metrics, it’s worthwhile to note that data alone isn’t enough for defensible documentation. Chart reviewers and insurers want to see measurable progress and understand how it translates to real-world function.
To accomplish this, clinicians need to tie the data back to the limitations and the impacts on daily function. For instance, it’s not enough to document the starting and current data points with a trend towards improvement. That data must then relate to both progress in daily life and an ongoing functional deficit that will be addressed by continued therapy. This is one way PTs use their skilled observations and understanding of function, paired with objective data to justify continuation of care for stroke patients.
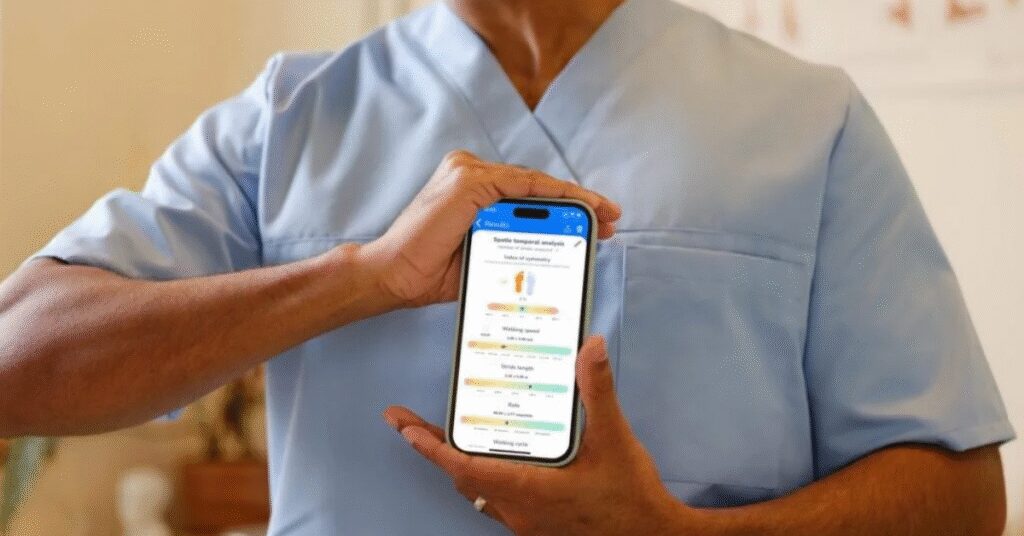
Let’s explore how gait metrics captured by REEV SENSE get paired with functional performance to support clinical justification in stroke rehabilitation.
To understand how data is reported by REEV Sense, view this sample report.
Types of Data for Measuring Gait in Stroke Rehabilitation
1. Measuring Speed & Cadence in Stroke Rehabilitation
Gait speed is often called the “sixth vital sign”, predicting independence, mortality, and quality of life post-stroke (Middleton, 2015). Even small improvements in speed and cadence are linked to better functional ambulation and increased participation in daily life.
In stroke rehabilitation, gait speed and cadence provide critical insights into a patient’s mobility. Slow walking speed can indicate residual weakness, pain, or fear of falling. This data, paired with an interview and observations, helps therapists identify specific mobility limitations.
Using the data to justify care:
Gait speed provides objective evidence of progress in walking efficiency, endurance, and independence. Even small increases can demonstrate meaningful functional gains, supporting the need for continued skilled therapy to improve safety, mobility, and carryover to daily activities. By quantifying improvements over time, and linking the data to daily function, clinicians can clearly show payers that physical therapy is medically necessary and producing measurable outcomes.
Example Documentation
“Patient’s gait speed increased from 0.35 m/s to 0.45 m/s over the past 4 weeks, reflecting improved walking efficiency and functional independence. Continued skilled therapy is warranted to further progress community ambulation and reduce fall risk.”
2. Measuring Stride Length in Stroke Rehabilitation
Through observation, a physical therapist can tell when a patient’s stride length is shortened or uneven, but it’s difficult to measure exactly how shortened their stride is or if it’s changing. By capturing stride length with wearable technology, clinicians can quantify those subtle changes and strengthen their documentation.
Using the data to justify care:
Measuring stride length and symmetry provides precise, objective measurements of an important component of walking. In the context of rehabilitation of a lower extremity that has been impacted by a stroke, small improvements in stride provide a unique data point within the process to restore safe functional mobility.
Example Documentation
“Measured stride length on the left LE increased from 0.48 m to 0.55 m over the past 4 weeks. This improvement correlates with slowly improving LLE strength and coordination and relates to improvements in strength and mobility to the bathroom with less risk of falling. Anticipate further gains with therapy focused on strengthening, gait training, and safety with functional mobility.”

3. Swing & Stance Time in Stroke Rehabilitation
After a stroke, patients often demonstrate altered timing during the walking cycle. They favor one leg, which increases their fall risk and reduces walking efficiency. Measuring swing and stance time allows clinicians to isolate specific motor control and strength challenges in the affected leg.
- Swing time: This is the period of time when the foot is off the ground, which highlights a patient’s ability to advance the limb. It reflects factors such as hip and knee control, foot clearance, and overall coordination.
- Stance time: This is the period when the foot is in contact with the ground, which provides insight into weight acceptance, stability, and balance. Shortened stance time often reflects limited confidence or reduced ability to load the leg.
Using the data to justify continued care:
Changes in swing and stance times provide objective evidence of impairments and then functional recovery. Increased stance time on the affected leg indicates improved capacity for weight-bearing. Barring compensatory patterns, longer swing time indicates better strength for limb advancement. These improvements relate to daily tasks such as transfers, stepping over thresholds, and stepping up curbs.
Example Documentation
“Measured swing time of affected limb: 0.38s. Stance time: 0.44s. Deficits in swing and stance duration continue to limit limb advancement and weight-bearing tolerance. Skilled PT intervention indicated to improve motor control, weight-bearing duration, and safety with household ambulation.”
4. Measuring Stance Symmetry in Stroke Rehabilitation
Stance symmetry measures how evenly a patient places weight through their legs during ambulation. People recovering from most strokes will spend more time on the non-affected side due to weakness, instability, and reduced confidence in the affected limb.
Tracking stance symmetry demonstrates how a person’s gait is becoming more balanced as they progress through rehabilitation. This information also helps clinicians refine interventions, adjust assistive devices, or modify orthotics to support safer movements.
Using the data to justify care:
Stance symmetry data allows clinicians to document quantifiable improvements in weight distribution. Even small shifts toward a more even stance pattern represent meaningful improvements in balance, muscle activation, fall risk, and functional ambulation.
Example Documentation
“Reassessment shows improved stance symmetry ratio from 62/38 to 56/44. Patient demonstrates increased loading through the affected limb. Functional gait drills and FES continue to address residual asymmetry, supporting ongoing functional progress and reduced fall risk.”
Bringing Clarity to Stroke Rehab with Objective Gait Data by REEV Sense
By capturing objective gait data, therapists can show that recovery is ongoing, even during periods where progress appears to plateau. These metrics provide measurable evidence of functional gains, strengthening the case for continued skilled intervention to payors, therapists, and patients.
For clinicians, it reduces uncertainty in documentation and provides the precise measurement needed to distinguish slow progress that is still benefiting from therapy from a true plateau that may indicate discharge. Ultimately, this gives patients the chance to reach their true maximum potential while reducing the risk of insurance denials.
With compact sensor technology and a convenient app for data reporting, REEV Sense makes it easy for physical therapists to measure and show progress in stroke rehab.
References:
Rubio Ballester, B., Maier, M., Duff, A., Cameirão, M., Bermúdez, S., Duarte, E., Cuxart, A., Rodríguez, S., San Segundo Mozo, R. M., & Verschure, P. F. M. J. (2019). A critical time window for recovery extends beyond one year post-stroke. Journal of Neurophysiology, 122(1), 350–357. https://doi.org/10.1152/jn.00762.2018
Hobson, Katherine. (2024). Stroke Recovery: What’s the Timeline? AARP.org. https://www.aarp.org/health/conditions-treatments/stroke-recovery-timeline.
Demain S, Wiles R, Roberts L, McPherson K. Recovery plateau following stroke: fact or fiction? Disabil Rehabil. 2006 Jul 15-30;28(13-14):815-21. doi: 10.1080/09638280500534796. PMID: 16777768. https://pubmed.ncbi.nlm.nih.gov/16777768/
Middleton, A., Fritz, S. L., & Lusardi, M. (2015). Walking speed: the functional vital sign. Journal of aging and physical activity, 23(2), 314–322. https://doi.org/10.1123/japa.2013-0236